
 |
 |
|
||||||||||
 |


 |
||
NatalieQ Information |
NatalieQ description
What is NatalieQ?
NatalieQ is a web server for topology-based alignment of a specified query protein-protein interaction (PPI) network to a selected target network aimed at identifying highly conserved subnetworks. It is an interface to the more general network alignment method Natalie [1,2], which has been shown to significantly outperform alternative methods in terms of alignment quality and running time in the case of sparse network alignment. A pairwise network alignment is a matching between the nodes of two input networks. For an illustration see Figure 1. The goal is to find a matching that maximizes the edge correctness, which is the fraction of matched query edges. In case multiple alignments with maximum edge correctness exist, the one that is most similar on the sequence level is prefered.
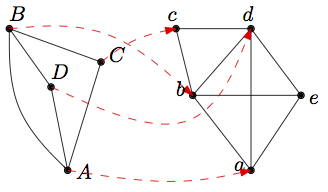
Figure 1: Network alignment. In the example, Nodes A, B, C, and D of the left network are matched with nodes a, b, c, and, d of the right network, respectively.
Basic priniciple
Given two PPI networks
and
and corresponding FASTA files containing the protein sequences, the server starts by computing an all-against-all sequence alignment using BLAST [3]. Subsequently, candidate matching edges are identified using pre-specified E-value cut-offs
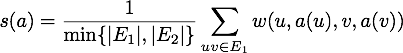
. For each
, Natalie computes a network alignment by maximizing the following scoring function:
Only alignment pairs whose E-values are less than
, we set
if and only if the aligned counterparts
are an edge in
and the confidence value of both edges is greater than a pre-specified threshold
. To disambiguate between solutions of identical edge correctness, we use sequence similarity, based on the bit-scores, as a secondary, subordinate, optimization goal.
NatalieQ input
NatalieQ is straightforward to use:
- Supply a query network in the form of a plain text file containing the edges. The format of your query network is automatically detected and can be one of the following:
- edge list: 2 colums per line; each line corresponds to an edge and contains two node labels separated by a space or a tab (see example).
- SIF: Simple Interaction File; ≥ 3 columns per line; each line contains a source node, a relationship type (or edge type) and one or more target nodes (see example1, example2).
NOTE:
• node names may not contain spaces as FASTA identifiers may not contain spaces. Thus, both spaces and tabs are seen as delimiters.
• There may only be one relationship type here as your network is used as one query network.- STRING: the network file available via the Save button in STRING, called: "Text Summary (TXT - simple tab delimited flatfile)" with filenames like "tabdelimited.KJ8r86Ow5Xxn.txt"
- MI-TAB: PSI-MI TAB format. This format can be downloaded from the IntAct Interactions table. The comment line (#) at the beginning should (preferable) be present (see example MI-TAB 2.7 file).
- Supply a protein FASTA file or have the proteins automatically retrieved. All edges should have a corresponding protein sequence.
- If the edges in the network correspond to UniProt, RefSeq or GI identifiers, the protein sequences corresponding to the nodes in the query network can be retrieved automatically. Example network files are provided for: UniProt identifiers, UniProt accessions and GI numbers.
- Upload a protein FASTA file yourself that contains protein sequences of the proteins represented by the nodes in the supplied query network (see example) sequence input for the example edge list. This will be required for STRING (file names like "protein_sequences.KJ8r86Ow5Xxn.fa") as STRING IDs are gene names. It may be required for mitab, depending on the identifiers you used.
- NOTE: automated retrieval may return different protein sequences at a later time due to versions. For example, UniProtKB IDs like MYC_HUMAN may return a slightly different sequence later. Thus:
- If you need to be sure what exactly the sequences are, upload the FASTA file.
- On the NatalieQ output page you can download the FASTA file containing the retrieved proteins.
- We do not remove version numbers of UniProt accessions. The newest sequence is always retrieved if no version is supplied. If you supply a version number (e.g. P04114.2) and this is not available (anymore), you will see an error:
	Not all sequences have been retrieved (found: 11 instead of 12).
	You can only use the auto-retrieve option for UniProt, RefSeq and NCBI IDs.
In such case, please remove the version numbers from the UniProt accessions.- Choose a target network by selecting a species and specifying one of three databases: IntAct, STRING-exp or STRING. Currently, NatalieQ offers PPI networks from the following species: Arabidopis thaliana, Caenorhabditis elegans, Drosophila melanogaster, Escherichia coli, Homo sapiens, Mus musculus, Rattus norvegicus, and Saccharomyces cerevisiae.
With respect to database updates, see below.- Set the required confidence value of interactions in the target network
.
- Select the scoring function. The default scoring function is topology-only as described above. The sequence-only scoring function maximizes the sum of the bit scores of aligned node-pairs.
- You may optionally give an e-mail address to which the link with the results will be sent to once the computation is completed.
Pressing "Run Natalie" will start the computation. This may take some time; the self-updating web page gives information about the status of the computation.
NatalieQ output
Once the alignments are computed, a result page with an overview table is shown. This table contains the edge correctness and sequence contribution scores for the various E-value cut-offs. In case consecutive runs have simlar results, the one with smallest E-value cut-off is shown in black and the others are grayed out. The sequence contribution score is defined as the sum of the bit-scores of the aligned node-pairs normalized such that the total sequence contribution is less than the score contribution of one conserved interaction (
).
By clicking on a run, a visualization of the network alignment and additional information of that run is shown. The visualization shows only the aligned part of the two networks and its environment. Red nodes and links are from the query network and grey nodes and links are from the target network. The visualization is interactive and is implemented using Javascript and the D3.js javascript library for information visualization. See the example output for an illustration of these concepts. Note that the example can always be generated in real-time by starting "Example Run".
Please note: while this interactive part works in all modern browsers on all platforms, it does not work in Internet Explorer 8. In case you have Internet Explorer 8 please upgrade to at least version 9; or use Chrome, Firefox, or Safari.
Interactive network graph
You can move and rotate the graph or pull nodes. If you click on a node a panel right (or below) of the network will show the query and target node IDs and the bit score and E-value of the sequence similarity as calculated by BLAST. In addition, the query and target description is shown. The latter are also shown in a tooltip if you hover over a node. You can toggle the display of the node labels by toggling the "Show node labels" checkbox. You can also toggle the visualization of unmatched target or query nodes and edges. The display of background non-mapped target nodes can be turned on and off. By clicking on the "Export SVG" button, the interactive visualization is exported to a static SVG file.Descriptions
If you hover over a node, you will see the query/target descriptions. If you click on a node, the available information (query/target ID, E-value and query/target description) is copied to the information table. The target descriptions were retrieved as follows:The links on target proteins in the information table of the graph and in the tables under Natalie query-target interactions take you to the original source database for more information on the clicked protein.
- STRING and STRING-exp: The taxonomy and sequence identifier were used to retrieve descriptions for the protein from the protein.aliases.v9.0.txt file. All text strings with a source matching UniProt_DE were collected. The different descriptions for a STRING protein are enumerated in the target description field on the results page. In total, 88% of the STRING proteins were assigned a description this way.
- IntAct: The IntAct UniProt identifiers were used to retrieve the full name and function of the proteins from the UniProt XML files (uniprot sprot.xml and uniprot trembl.xml). This resulted in the assignment of names and/or function descriptions to 97% of all proteins.
Natalie query-target interactions
In the "Natalie-query target interactions" section of the results page the following tables are shown:
- Alignment;
This table lists the query nodes together with their aligned counterparts. Also the bit scores and descriptions are shown.- Conserved interactions;
Interactions that are present in the query network and conserved in the target network are shown in this table.- Interactions in query network but not in target network;
Interactions that are present in the query network but not conserved in the target network are shown in this table.- Interactions in target network but not in query network;
Target nodes sharing an interaction whose counterparts in the query network do not have an interaction are shown in this table. Interactions that are present in the query network but not conserved in the target network are shown in this table.Data download
The sequence alignment results are available as a separate download as well as the Natalie console output containing detailed information on the solver. In addition, the four tables described above are offered for download as CSV files allowing for further offline analysis. Analysis in Cytoscape is facilitated by the availability of a SIF file containing the query network and matched parts of the target network; node and edge labels are provided in the NOA and EDA files, respectively.Database updates
We will regularly update the STRING and IntAct databases on our server. We aim to update IntAct at least every three months and STRING upon new (major) releases. At the moment, we are developing automated updates for IntAct. In case the last version is not available on our server yet, and you require the last version, please mail us.References:
- Klau, G.W. (2009). A new graph-based method for pairwise global network alignment. BMC Bioinformatics 10(Suppl. 1):S59.
- El-Kebir, M., Heringa, J. and Klau, G.W. (2011). Lagrangian relaxation applied to sparse global network alignment. In: Proc. 6th IAPR International Conference on Pattern Recognition in Bioinformatics (PRIB 2011). LNCS 7036, pp. 225-236, Springer, 2011.
- Altschul, S.F., Madden, T.L., Schäffer, A.A., Zhang, J., Zhang, Z., Miller, W. and Lipman, D.J. (1997). Gapped BLAST and PSI-BLAST: a new generation of protein database search programs. Nucleic Acids Res. 25:3389-3402.
(c) IBIVU 2026. If you are experiencing problems with the site, please contact the webmaster.