This is an exerpt out of the 'Sequence Harmony' main publication, Methods section by Walter Pirovano, K. Anton Feenstra and Jaap Heringa "Sequence Comparison by Sequence Harmony Identifies Subtype Specific Functional Sites", Nucl. Acids Res., 2006, Vol. 34, No. 22 6540-6548.
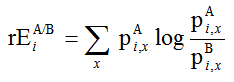
Relative entropy (rE) is commonly used in sequence comparison to quantify the degree of conservation [1,2]. It is derived from Shannon's general information entropy [3] as applied to biological sequences by Shenkin et al. [4]:
 (Eq. 1)
where pAi,x and pBi,x are the observed probabilities of amino acid type x at a position i in the alignment of groups A and B, respectively. Relative entropy measures the difference in information content between both distributions of amino acid types. Interestingly, for sites to be maximally different between the two groups, amino acid types in one group should be absent in the other or vice versa. This will lead to a degenerate result (singularity) when the entropy function of Eq. 1 is used. Inclusion of so-called 'pseudo-counts' solves the degeneracy but not the unbounded, asymptotic behaviour of Eq. 1. Also taking, e.g., the relative entropy with respect to both groups, as rEA/ABi,x = Si pAi,x log ( pAi,x/pABi,x ) , does not solve the unbounded behaviour. Moreover, the upper limit is not fixed but can vary from 1.0 upwards depending on the ratio of the number of sequences in both groups.
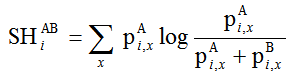
Addressing the degeneracy of Eq. 1 can be done by defining Sequence Harmony as
 (Eq. 2)
This can be viewed as the relative entropy of group A relative to the sum of the probabilities of both groups (pA + pB). As a consequence of the separate weighting of both groups, we eliminate the dependence on relative group sizes.
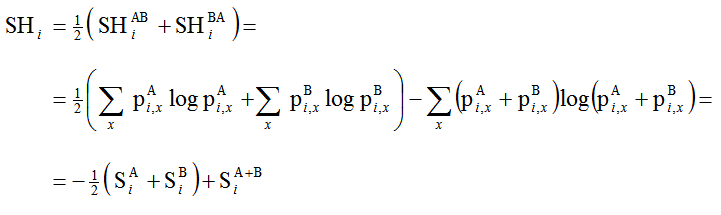
We note that, in general, SHAB != SHBA and propose to remedy this non-commutativeness by taking the average. Using Eq. 2 this leads to:
 (Eq. 3)
where S is Shannon's information entropy (note that in this notation SA+B != SAB). In other words, SH can also be conveniently expressed as a simple linear combination of entropies.
The SH function juxtaposes relative entropy since it becomes zero for maximally different sites and one for sites with identical distributions. Therefore, we coined the phrase Sequence Harmony (SH) as it indicates to what extent amino acid compositions between two groups of sequences are in harmony.
|
Table 1: Hypothetical alignment of two subfamilies A (4 | ||||||||
| Alignment Position | ||||||||
| 1 | 2 | 3 | 4 | 5 | 6 | 7 | 8 | |
| GROUP A | ||||||||
| seq1 | R | E | L | A | A | A | K | K |
| seq2 | R | E | L | A | A | F | K | K |
| seq3 | R | E | A | A | A | Y | R | K |
| seq4 | R | E | A | A | A | F | R | K |
| GROUP B | ||||||||
| seq1 | H | N | V | A | A | Y | R | K |
| seq2 | H | N | V | F | F | Y | R | K |
| seq3 | H | N | F | F | A | F | K | K |
| seq4 | H | S | F | F | F | Y | R | K |
| seq5 | H | S | M | F | F | F | K | K |
| seq6 | H | T | M | F | F | Y | K | K |
| SH | 0.00 | 0.00 | 0.00 | 0.35 | 0.54 | 0.79 | 1.00 | 1.00 |
To illustrate how SH works in practice, we present a hypothetical alignment in Table 1. Positions 1, 2 and 3 all have a SH value of zero. In fact, the formula becomes zero any time the aminoacid composition in one group is completely different from the other group, regardless of conservation. At position 4, the aminoacid of group A (Ala) also occurs once in group B, yielding the lowest possible non-zero score for this number of sequences. For positions 5 and 6, there is an increasingly overlap and hence growing SH values. Position 8 is overall conserved in the whole family and is therefore maximally harmonious with a SH value of one. Note that unconserved sites will have SH=1 whenever the two groups have identical compositions. This is illustrated in position 7, where equal proportions of R and K are shown. The example can be downloaded as Fasta file and the corresponding output can be viewed as well.
The SH measure is coded in a simple online server for calculating SH from an alignment. It can be accessed at www.ibi.vu.nl/programs/seqharmwww.
The example of Table 1 shows that sites with different column compositions can lead to identical SH values, which therefore cannot be ranked. This is particularly important for sites with SH=0, as these are potentially discriminative for function. To address this issue, we derived a simple but effective ranking for identically scoring sites based on the distribution of low SH values (SH≤0.2) in neighbouring residues in the sequence. Groups of sequentially adjacent low harmony sites can have one intermediate high-harmony site in between, i.e. the sequence distance is two or less. The final ranking is then first on increasing Sequence Harmony (low harmony first), and then on decreasing group size (larger sequential groups first). It is clear that this primarily affects the predictions of zero harmony. For Finally, ranking of sites that have equal SH scores and group sizes are ranked on the total entropy of the sites in both subfamilies. This is what we will call the Sequence Harmony method which we will label 'SH'.