
 |
 |
|
||||||||||
 |


 |
||
NGS-eval Information |
NGS-eval: NGS Error analysis and VAriant detection tooL
What is NGS-eval?
NGS-eval is an interactive web server for error analysis and sequence variant detection in amplicon-based NGS mock (or marker gene) data sets. The input consists of data for only a single NGS sample and the reference sequences of your marker genes. You can interactively analyse the sequence data by plotting the different types of sequencing errors along the different reference sequences. The results can also be downloaded to be analysed and plotted in programs of your choice.
This web server
With this server, you can:
- find sequence variants in your NGS amplicon reads and calculate the sequencing error rates. You need to provide the reference sequences and the reads of your sample. Since only a single sample from your NGS run is uploaded, your data first has to be demultiplexed (if needed) and is preferably chimera-free.
- interactively plot the error data per reference sequence.
- export plots or data and/or download the data to generate the graphics in your preferred plotting software.
- download data on sequencing errors.
- download consensus sequences. These are calculated from your reference sequences and amplicon-based NGS reads.
Worked example
Use case
This server can be used to detect new sequence variants. During our previous studies, we calculated error rates uses a mock community and were faced with strange error rates. We have used the code in this server to detect what was going on with the reads and uncovered seven unknown sequence variants.
For more information, see the sections below.
NGS-eval input
Reference sequences
Upload an (uncompressed) text-file with the nucleotide sequences of your marker gene references in FASTA format. These sequences typically are 16S rDNA amplicon sequences of the species in your mock sample. However, the sequences (and corresponding reads) can be any marker gene. We recommend that:
- you trim the reference sequences of your marker gene to the region that is sequenced. This will generate clearer results and generate them faster. For 16S rDNA MiSeq reads, we truncate the reference to the hypervariable region used (V4, V1-V2) and, if the paired-end reads are not merged, to the read length. The server now supports in silico PCR and length truncation of the reference sequences (see Options). Alternatively, the sequences can be trimmed/truncated prior to uploading using alignment editors (e.g. Jalview, MEGA) or local in silico PCR (e.g. EMBOSS primersearch or search_prc in usearch v8.
- the reference sequences do not contain ambiguous base codes.
NGS reads
The reads of your NGS (mock) sample are uploaded here. Please note that this server is not intended for the analyis of large data files, but rather a single NGS sample that generally contains only between 1% to 3% of the output of an NGS run (file sizes of 1 Mb to 20 Mb).
To separate the mock sample from the rest of the NGS data, if needed, you may first need to demultiplex your NGS data. In addition, the reads uploaded to the server ideally are free of contaminants and chimeras, so that the estimated error rates reflect only the sequencing errors and not include the bias from chimeric reads. Finally, if you have paired-end data, you may choose to first merge the forward and reverse reads.
Check Reverse in case you upload the reverse reads (from paired-end sequencing). Generally, the forward read has the same orientation as the uploaded references sequences. The Format (FASTA or FASTQ) and the Compression are detected automatically. In case you encounter issues with this, select the format and compression status of your reads file.
FASTQ or FASTA? If you upload a FASTQ file, the quality scores are included in the output. This requires more processing time. If you are not interested in the quality, you can upload a FASTA file. If you have FASTA and QUAL files, please create a FASTQ file locally (e.g. using QIIME).
Example: The mock sample used as the example input was sequenced on an Illumina MiSeq platform and contains 43707 reads after chimera removal (filtered as described above). It is 4.7Mb in size (gzipped, FASTQ format). The server will return average quality values for each base in the plots (for FASTQ files).
Options
The following options are available:
- Forward primer
- You can provide the sequence of the forward primer. The sequencing errors that occur at the locations of the ambiguity codes can be masked by selecting "Expand degenerate bases". If you provide the forward and the reverse primer, it is possible to trim the reference using in silico PCR.
- Reverse primer
- As above. The reverse primer should be provided in the 5'→3' direction, thus not as its reverse complement.
- Truncation length
- The reference sequence (and reads) will be truncated to the supplied length. This can be useful when your amplicon is longer than your read. This occurs, for example, when V3-V4 or V4-V5 regions of 16S rRNA genes are sequenced with 500 cycles paired-end on MiSeq. After truncation, the truncated references, are made non-redundant.
- Set truncation length to longest read
- As above. However, the reference sequence (and reads) will be truncated to the longest read in the data set. Using this option you do not need to check/guess what the longest read length is. (500 cycles paired-end on MiSeq does not necessarily mean that your longest read is 250 nt long.)
- Expand degenerate bases
- You can choose to expand the ambiguity codes in your primer. When you check this option, for example, an "R" in your primer will match an "A" in a read. This way, such literal mismatches will not be regarded errors. If your primer does not contain ambiguity codes, you do not need to check this option.
Note: you cannot use ambiguity codes as so-called character classes, like [GA].The IUPAC ambiguity codes are (also see base codes and their reverse complement):
Ambiguity code Expansion B TGC D TGA H TCA K TG M CA R GA S GC V GCA W TA Y TC - PCR reference sequences
- If you provide both primers, it is possible to PCR your reference sequences. Clearly, the reference sequences need to include both primers. This opion is useful if you have full-length marker gene sequences available. After the in silico PCR, the amplicons, produced from the references, are made non-redundant.
- Remove primers from the reference amplicon sequences
- If this option is selected, the primer sequences will be removed from the produced amplicons. Use this option if you use the reads do not include the primer sequences. (E.g. when you use a sequencing protocol similar to Caporaso, 2011).
Note: this option can only be selected if you selected "PCR reference sequences".- Advanced options
E-mail address
If you supply your e-mail address, the URL of the results page is sent to you when your job is finished. Providing your e-mail address is optional. You can also bookmark the results page to access the results at a later time. Results are generally kept for two weeks.
Processing details
NGS-eval output
The example output can be regenerated by running the example input. Below, we describe the different sections of output page.
Overview section
This section provides links to jump to the section of your interest and contains brief hints for the interactive analysis.
Interactive graphs section
Here you can interactively analyse the errors for each reference sequence. This section contains the following:
Select reference: select the reference sequence from this drop-down menu. Upon selection, the data will be plotted. This menu contains the reference sequences to which reads were mapped. If provided in your FASTA file, this menu contains a sequence description.
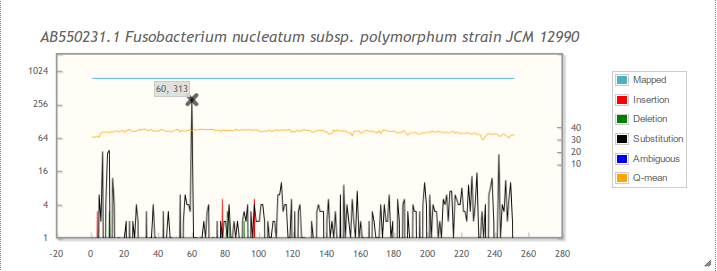
Plot series: select the series you wish to plot. Mapped refers to the number of sequences mapped to the reference sequence. Insertion, deletion and ambiguous are the different types of errors. An ambiguous error is any mismatch in the alignment of a base and an "N". It also includes N vs. N, which can occur if your reference sequence contains an N.
By default, sequence and Q-mean are not checked. The latter option is only present if you uploaded a FASTQ file (which contains the quality scores) and shows the average quality score. The sequence series will add the reference sequence to the plot.
Scale: You can select a relative scale (0-100%) and/or a logarithmic scale (base 4). With the relative scale, the errors are calculated relative to the number of reads mapped to the specific position in the sequence. Note: When the relative scale is selected, the errors are plotted relative to the number of mapped reads at a specific position. This can result in large error peaks towards the end of the reference sequence. For example, when only 5 reads are present at the end and all contain an error, the error percentage is 100. This can happen when, for example, chimeric reads are present.
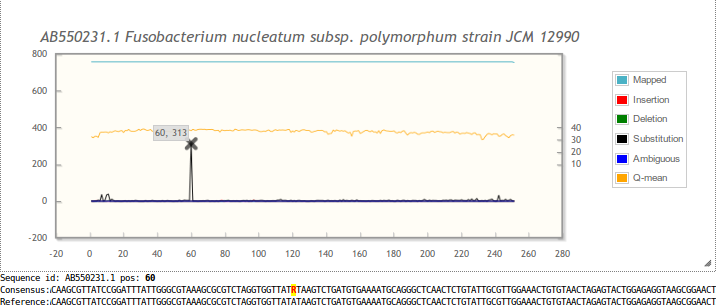
Plot: the plot can be zoomed into. See the hints in the Overview section of results page (example). Hovering over a data point shows the coordinates. When hovering over large insertion peaks (≥10%; processing details) their average length and base frequencies are added to the tooltip. When hovering over Q-mean, statistics for the Q-scores are added to the tooltip (minimum, first quartile, average, median, third quartile and maximum).
When clicking on a data point, the corresponding position in the consensus sequence below the plot is highlighted. Differences between consensus and the reference sequence are shown in red in the consensus sequence. Often, these are IUPAC ambiguity base characters.
Downloads section
Detailed error reports are available for download. For use in your local applications, also the reference consensus sequences and plot data are provided. The links below take you to the files of the example output.
- Error reports:
- the summary report contains an overview of the different error ratios and the total counts of each occurrence, such as deletions.
- the detailed report contains details of all deletions, insertions and substitutions per read on nucleotide level.
- the zip file contains both reports above, as well as a separate detailed report for each reference sequence. The latter is the same as the general detailed report (point 2 above), but these files contain one reference sequence.
- The consensus sequences are based on the read to reference mapping. These sequences are provided below the plot in the interactive graphs section.
- For users of the plotting software Xmgrace, a zip file with plot files is provided.
- The plot data is also provided in a tab-delimited format for offline use (zip file plot data).
(c) IBIVU 2024. If you are experiencing problems with the site, please contact the webmaster.